One Table, 41.8 GB/s: Linear Scaling Across 455 1-vCPU Containers
Snowpipe Streaming Elastic Channels benchmark: 455 1-vCPU Kubernetes workers push uncompressed single-table throughput to 41.8 GB/s and 133.5 million rows/s. Linear scaling, stable latency, and the test harness is open source.
41.8 GB/s. 133.5 million rows/s. One Snowflake native table.
Snowflake published a benchmark of Snowpipe Streaming Elastic Channels (full report). On an EKS cluster in AWS us-west-2, 455 Kubernetes workers simultaneously wrote to the same table, sustaining uncompressed throughput of 41.8 GB/s and a row rate of 133.5 million rows/s. Scaling from 15 workers to 455 produced linear throughput growth with no plateau.

Elastic Channels is a new Snowpipe Streaming capability, entering GA this year. Snowpipe Streaming is Snowflake's streaming data ingestion service: applications send event data directly to Snowflake tables. The previous generation required clients to manage channel names, record offsets, and coordinate schemas. Elastic Channels moves this to the server side; applications just call client.get_elastic_channel() to get an automatically pooled channel and append directly.
The tradeoff is that semantics drop from exactly-once to at-least-once. Use cases requiring strict semantics, such as CDC and financial transactions, should continue using the older interface. Telemetry, logs, and IoT device traffic are better suited to Elastic Channels.
The test workload was synthetic: POS transactions from 42 virtual ski resorts, with each row about 277 bytes of NDJSON. Data generation and serialization were done in Rust, bypassing the overhead of constructing Python dicts row by row and the SDK's double encoding. Each worker had only 1 vCPU / 1 GiB of memory, with 31 pods packed onto a single Graviton node.
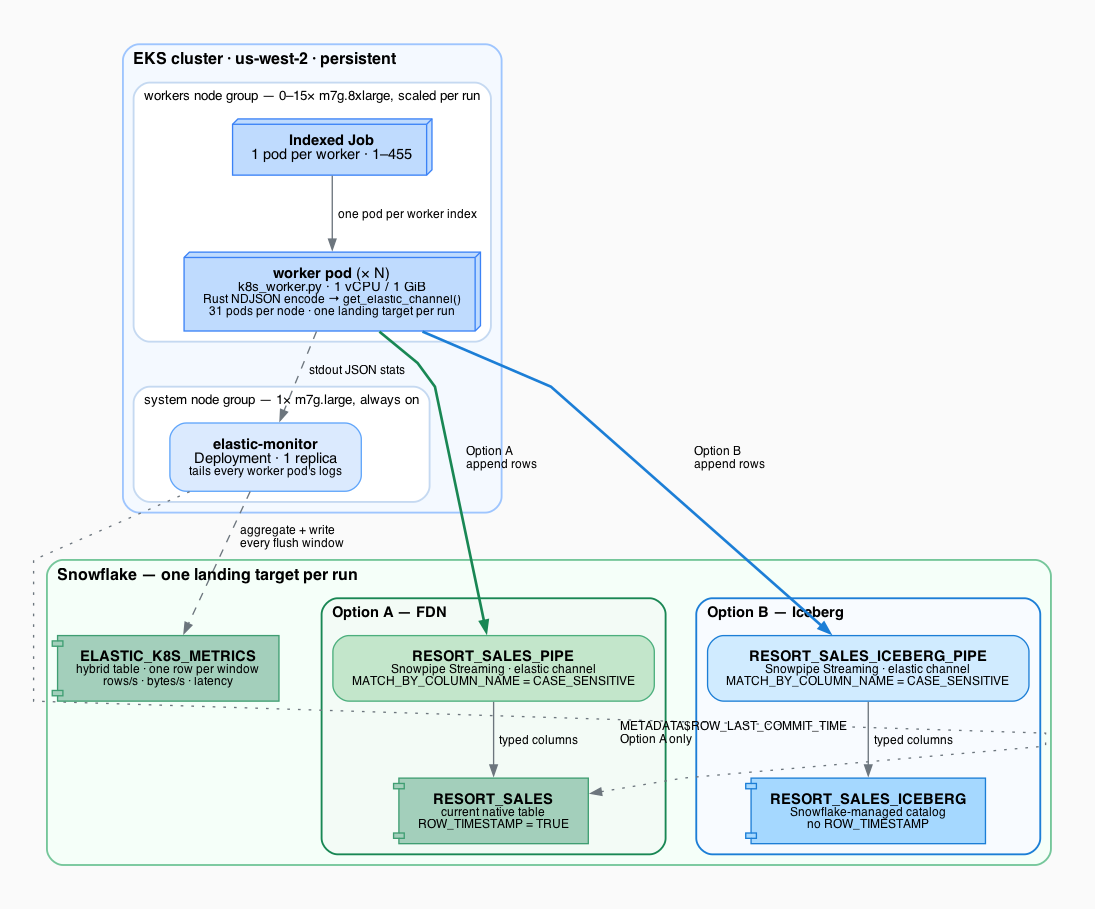
The core numbers from the results:
| Metric | 15 workers | 455 workers |
|---|---|---|
| Throughput | 1.38 GB/s | 41.84 GB/s |
| Row rate | 4.4M/s | 133.5M/s |
| Batch ack | 582 ms | 570 ms |
| Ingest-to-visible | 11.7 s | 19.9 s |
Scaling is linear. Each worker consistently contributes about 92 MB/s and 293K rows/s, with no degradation as the cluster grows.
Latency does not rise with throughput. Batch ack stays between 570 and 611 ms throughout, and clients never wait for Snowflake to digest data. Ingest-to-visible consistently lands between 12 and 29 seconds. The row rate increased 30x, while this latency barely changed.
Resource efficiency is extreme. A commonly cited industry benchmark for gigabyte-scale single-table ingestion used 2,048 workers, 3,072 cores, and 4,096 GiB of memory to reach about 12 GB/s. Snowflake reached 41.8 GB/s with 455 cores, 455 GiB, and 455 processes—one-seventh the cores, one-ninth the memory, 3x the byte throughput, and 10x the row rate.
The interesting part is where the bottleneck sits. Client-side overhead—serialization, channel management, offset tracking—often holds things back more than the server side. By stripping that out, Elastic Channels lets small 1-vCPU containers saturate single-table throughput.
The full toolset is open source on GitHub: snowflake-labs/snowflake-elastic-channels, including EKS deployment scripts, a Python SDK wrapper, a Rust native encoder, and a Streamlit monitoring dashboard. Reproducing it does not require 455 workers; a 60-second single-worker smoke test can validate the full path.
One engineering detail is worth noting: the Rust encoder did not rewrite the business logic. Weight tables and price strings were generated from Python code, and Rust only performed lookups and formatting. UNIT_PRICE and AMOUNT were fixed as decimal strings during code generation, so float handling in the two languages can never diverge. A unit test verifies that both paths output byte-identical NDJSON.
This is a bounded test: single region, single account, single table, single row shape. To run at this scale, you first need to contact Snowflake to raise account capacity. The comparison is against an older architecture demo from the 2024 Summit, not a controlled side-by-side.
But the direction is clear: the bottleneck in the ingestion pipeline is on the client side, and it can be eliminated. If you build log and telemetry pipelines, the code is open source—run it once and you'll know whether it fits.
Snowflake also published a demo video of Elastic Channels in an IoT scenario: Watch the video.
发布时间: 2026-10-27 07:40