SWE-bench from 7.3% to 27.5%: Agent RL on AMD MI355X Is Bottlenecked by Sandboxes and Long Tails
LMSYS and AMD use Miles to train a Qwen3-30B-A3B SWE agent on MI355X. The results are striking: pass@1 on a SWE-bench Verified subset rises from 7.3% to 27.5%, and rollout throughput is about 4x. What is more interesting in the report is that the main cause of slow training was repeatedly misdiagnosed as the GPU, while in reality it was often long-tail trajectories, CPU sandboxes, and hidden concurrency limits.
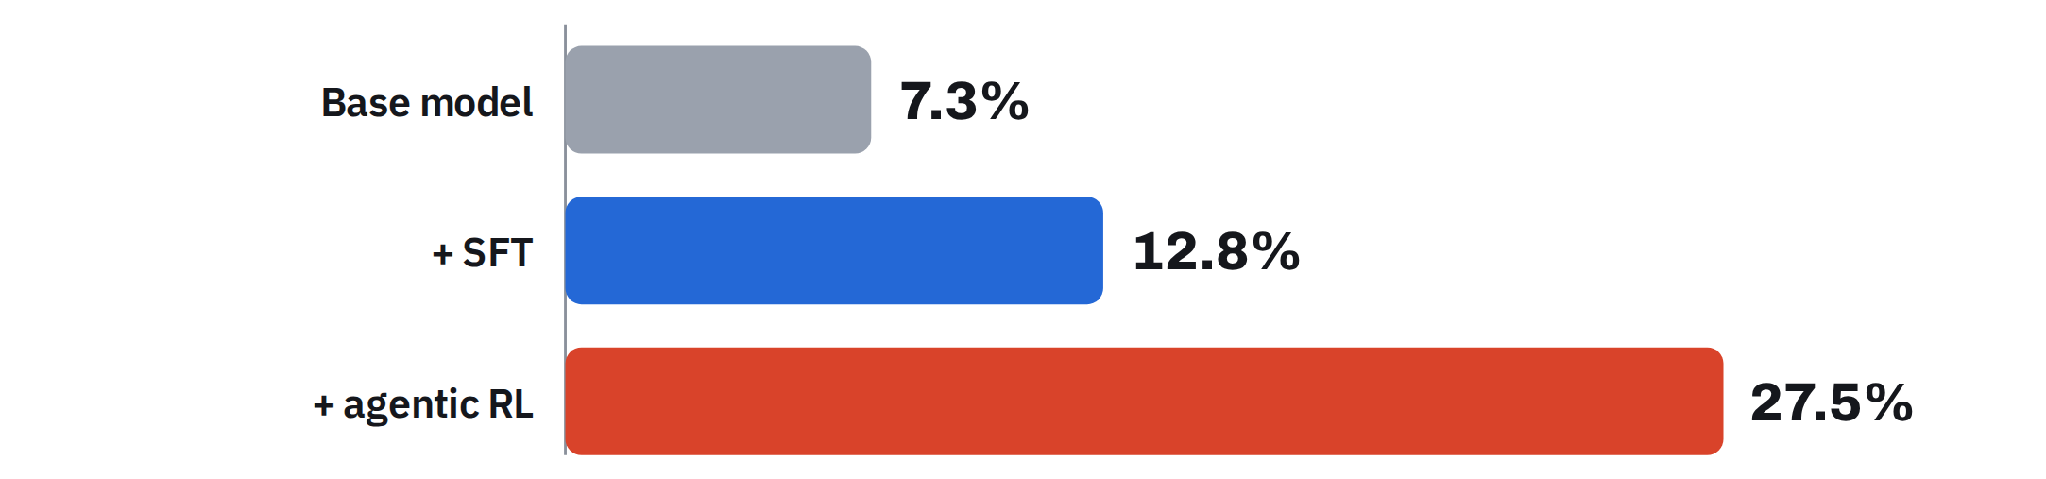
LMSYS Org shared a technical report from the AMD and Miles teams: on AMD Instinct MI355X, they trained a Qwen3-30B-A3B-Instruct SWE agent using Miles, SGLang, Megatron-LM, and Harbor. In the end, on 100 stratified tasks from SWE-bench Verified, with 4 attempts per task, pass@1 rose from 7.3% to 27.5%.

Let's break down the gains. SFT over one epoch on about 4,000 public agent traces raised pass@1 to 12.8%. Then asynchronous GRPO trained on about 1,350 SWE-smith tasks from 47 repositories that do not appear in SWE-bench Verified. RL added another 14.7 percentage points, bringing the final result to 27.5%. This gain is measured on codebases the policy did not see during the RL stage.
An Agentic RL sample is a full episode: the model reads an issue, runs 20 to 100+ shell commands in a sandbox, edits code, and receives reward only if the repository tests pass at the end. A GRPO group must wait for the slowest attempt to finish before it can be scored. The report observed that two attempts at the same task can differ in length by 2.5x. The long tail directly holds back training.
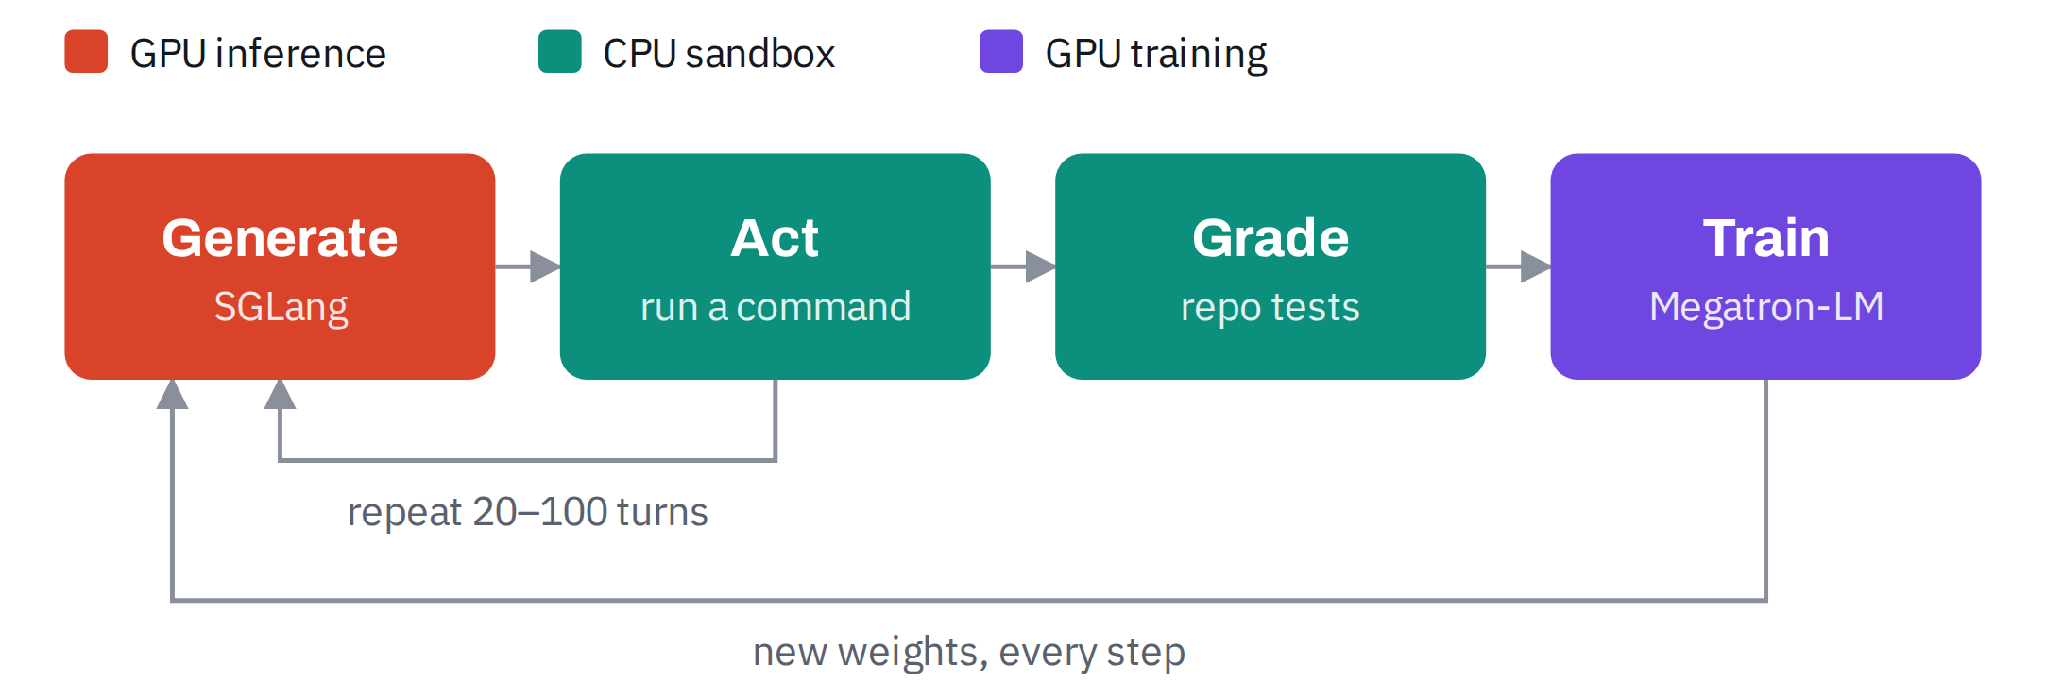
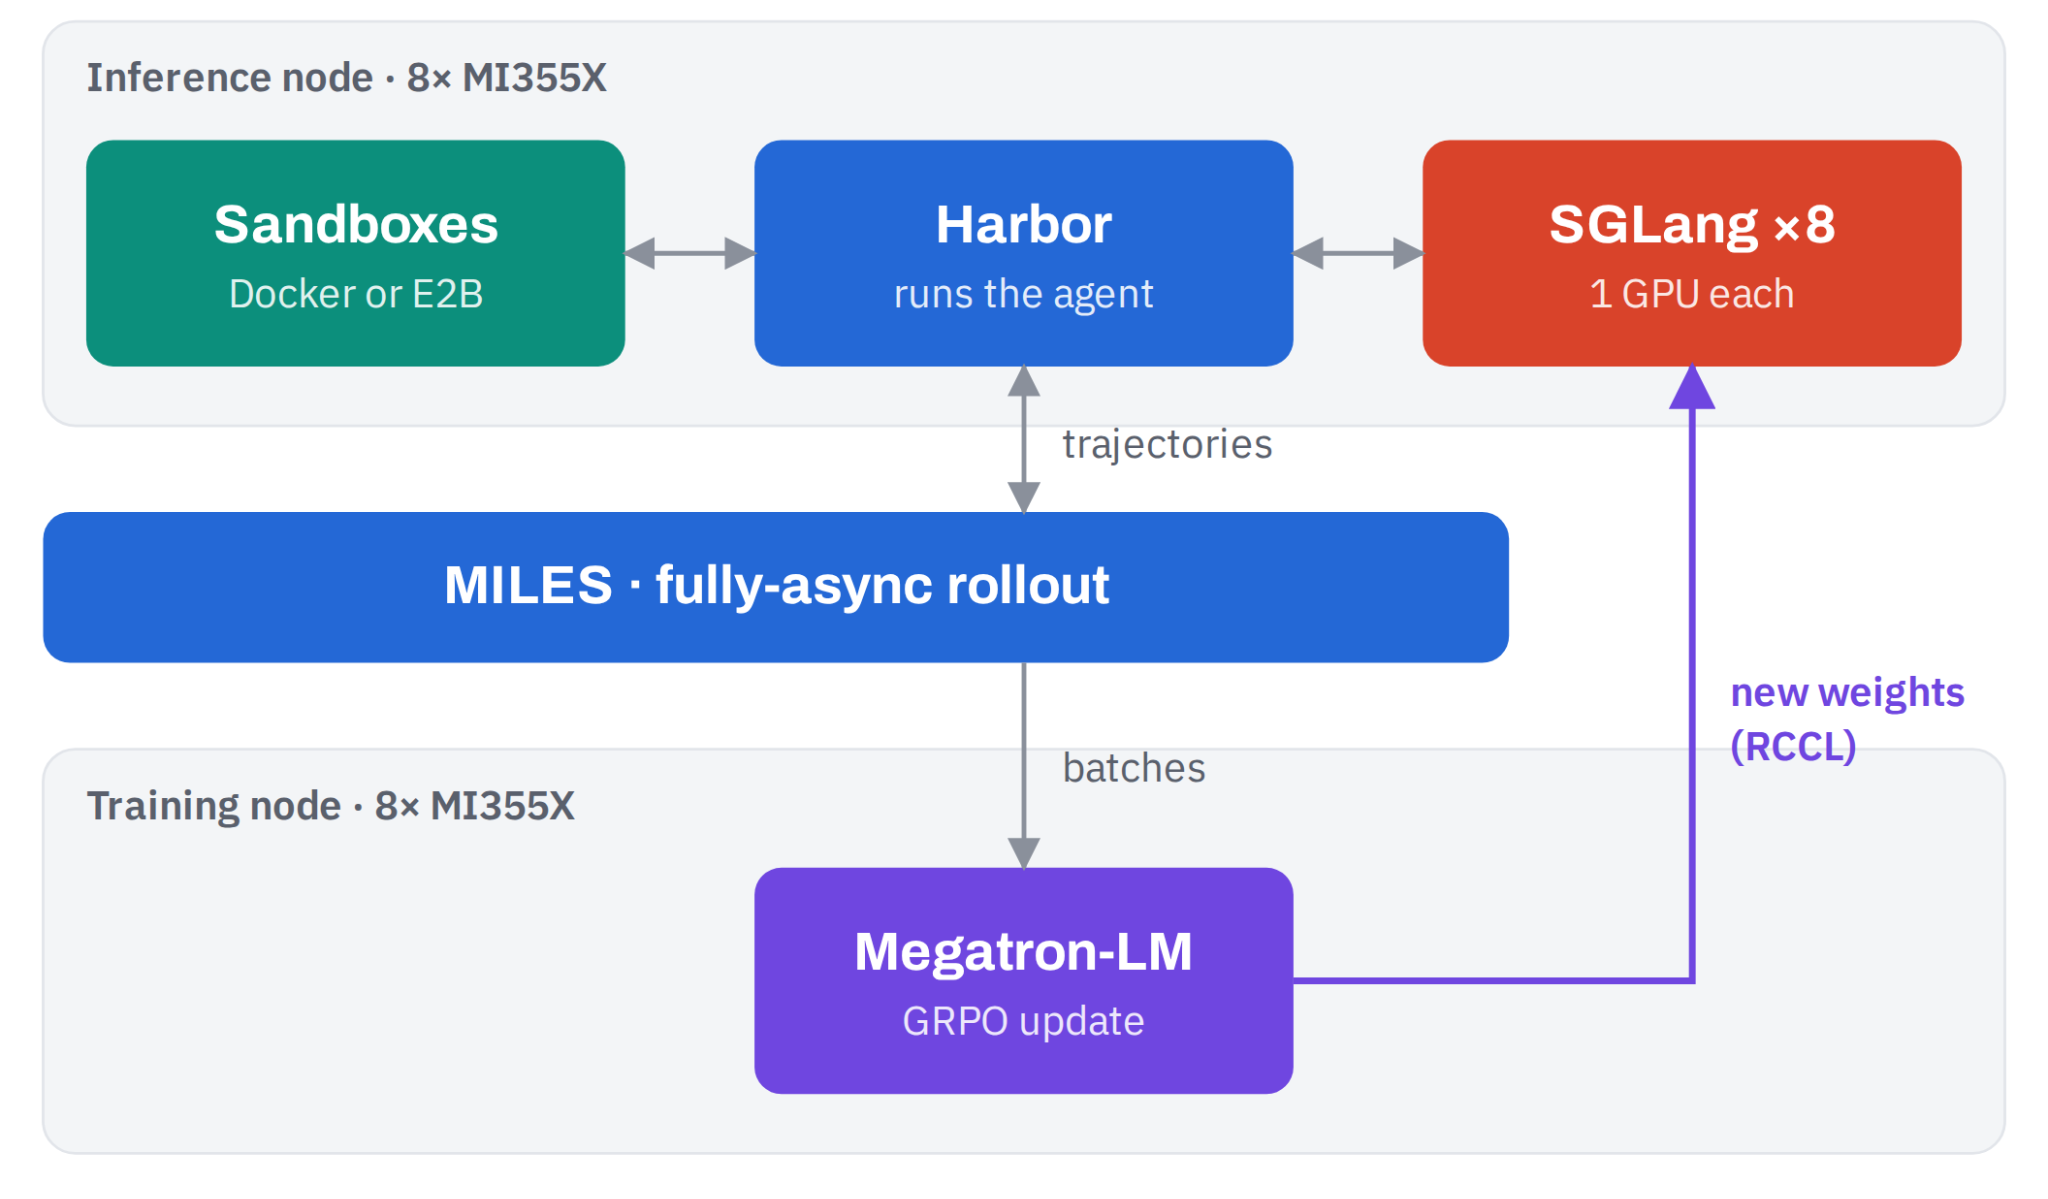
Architecturally, inference and training run on separate nodes. Inference nodes run 8 single-GPU SGLang engines and Harbor, with Harbor managing sandboxes. Training nodes run Megatron-LM and push new weights back to the engines. Training is fully asynchronous, with rollout and training overlapping. The trainer proceeds as soon as it has enough completed trajectories; it does not wait for the slowest one.
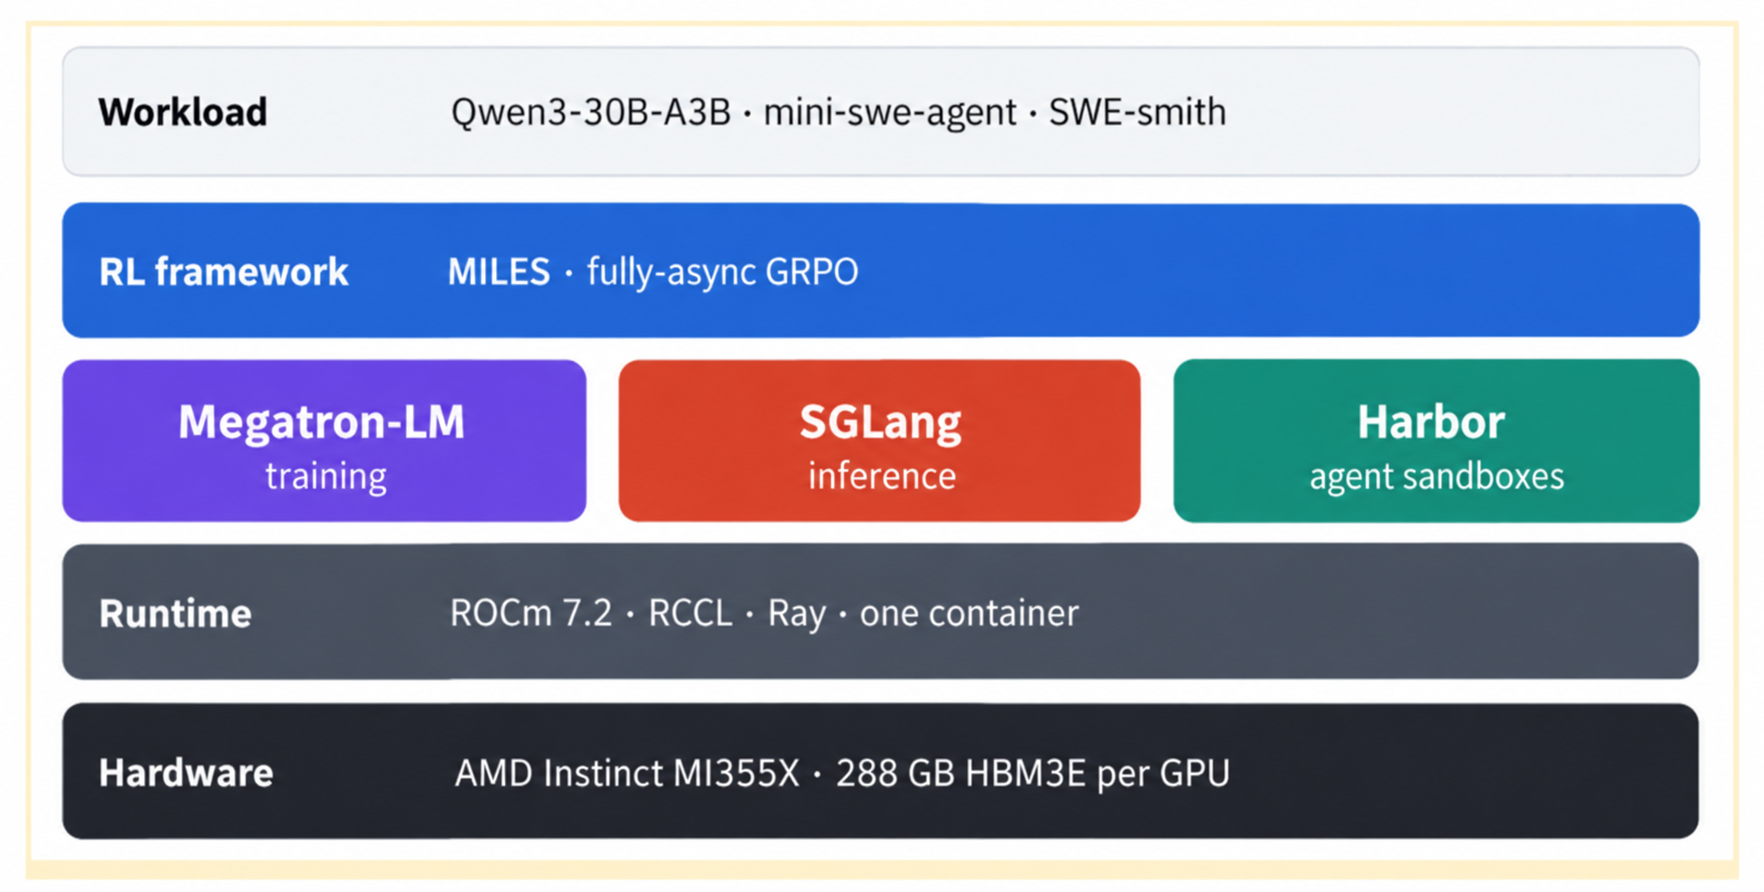
The software stack is entirely open source and packaged in a single ROCm container: Miles for fully asynchronous GRPO, SGLang for inference, Megatron-LM for training, Harbor for managing agents and sandboxes, ROCm 7.2, and MI355X hardware with 288 GB HBM3E per GPU.
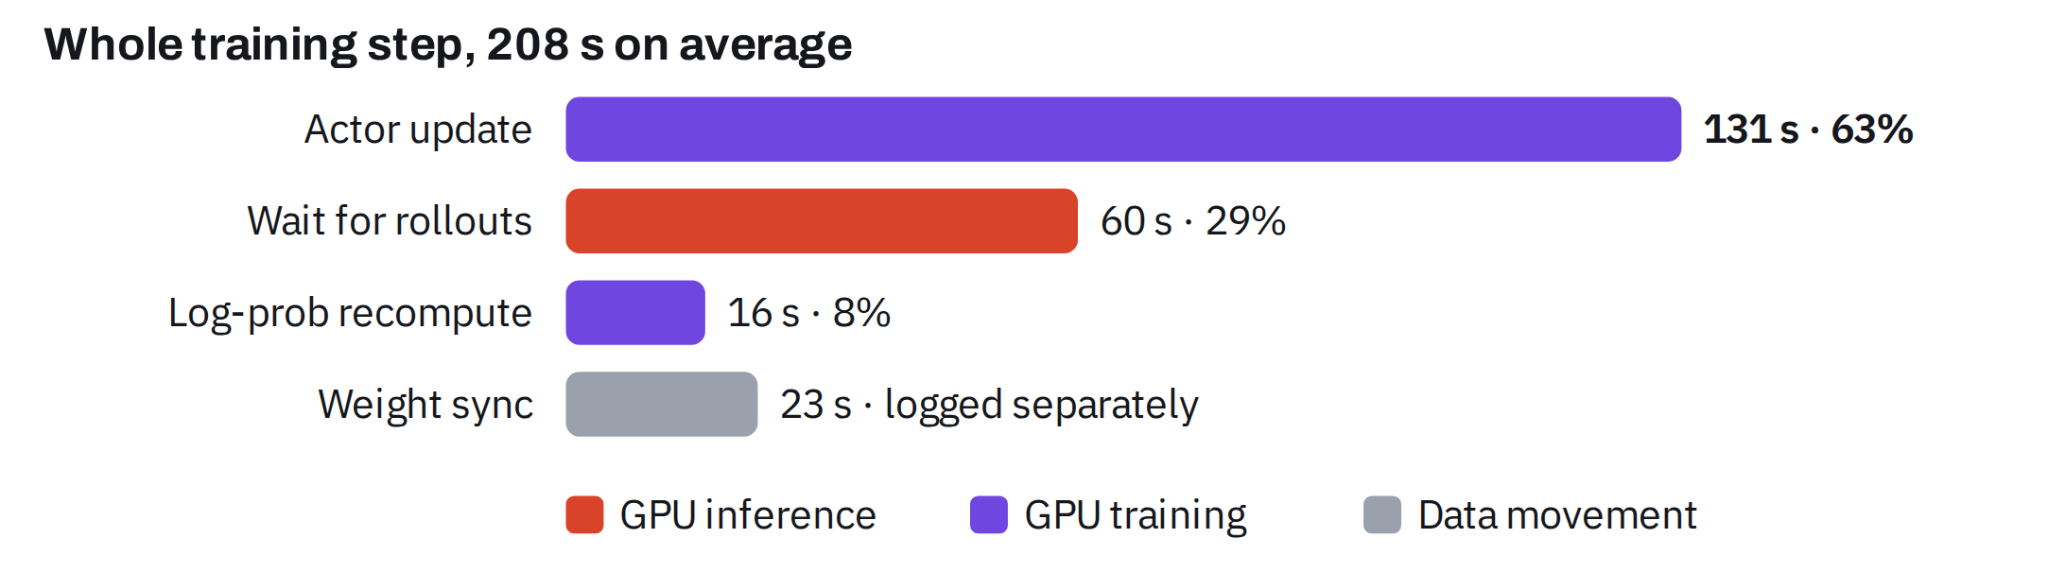
Breakdown of training-side step time: actor update accounts for 63%, waiting for rollout for 29%, and logprob recomputation for 8%. Weight synchronization is accounted for separately. Using fully asynchronous training plus a tighter length cap, they reduced step time from 850 seconds to 284 seconds, about 3x. Successful trajectories were unaffected.
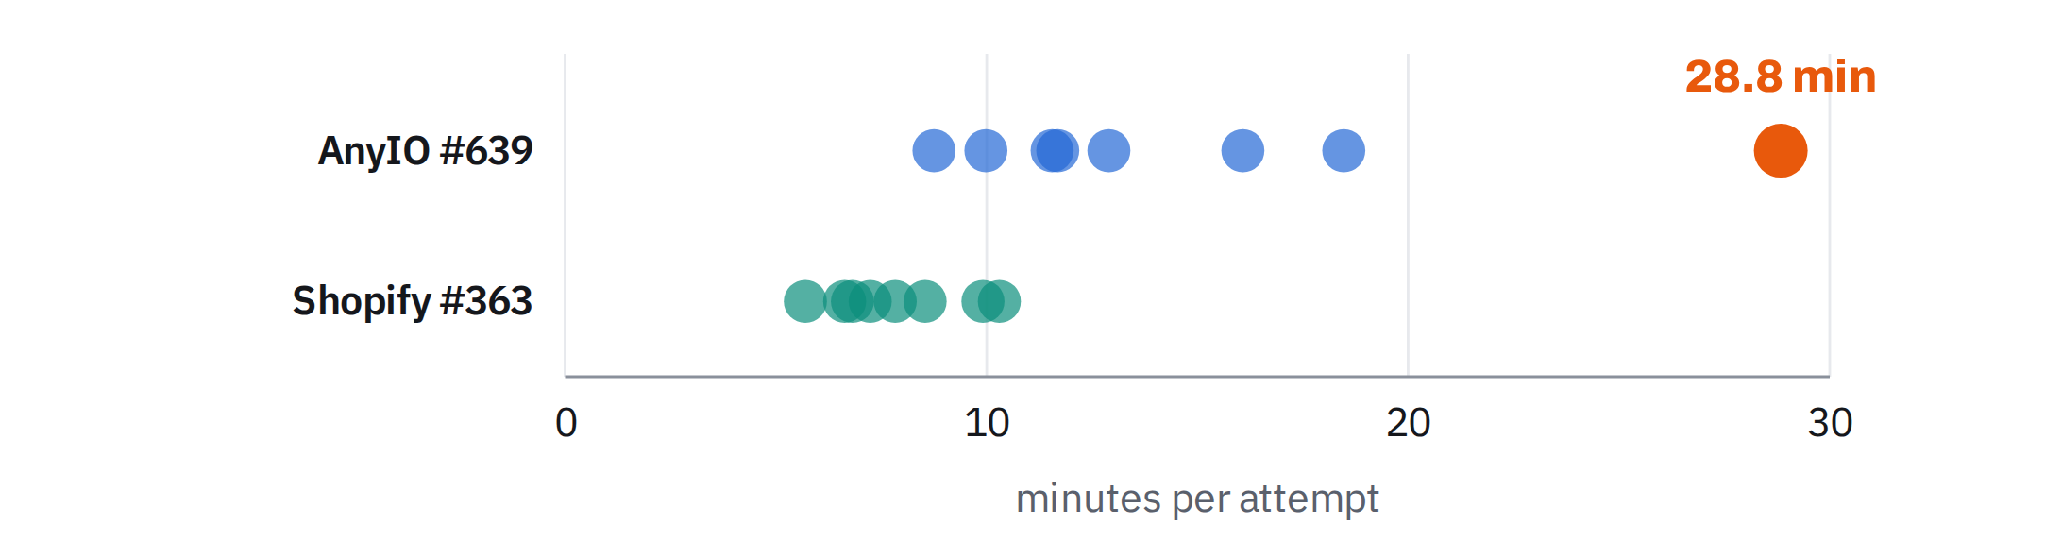
How long is the long tail? 84% of trajectories hit the turn cap, while the median successful trajectory needs only 8 turns. 32% of rollout time occurs after 90% of trajectories have already finished. The slowest AnyIO attempt took 28.8 minutes. On the chart it looks like the GPU is waiting, but it is actually a decode tail with a batch size close to 1.
KV cache was another pitfall. According to the numbers in the report, a 64K-token trajectory requires 6.3 GB of KV cache. When the engine had no context limit, a few generations grew to 113K–186K tokens; about 10 of them filled the 1.5M-token KV cache, and the other 99 requests on the same engine queued until timeout. After capping engine context at 64K, the problem disappeared.
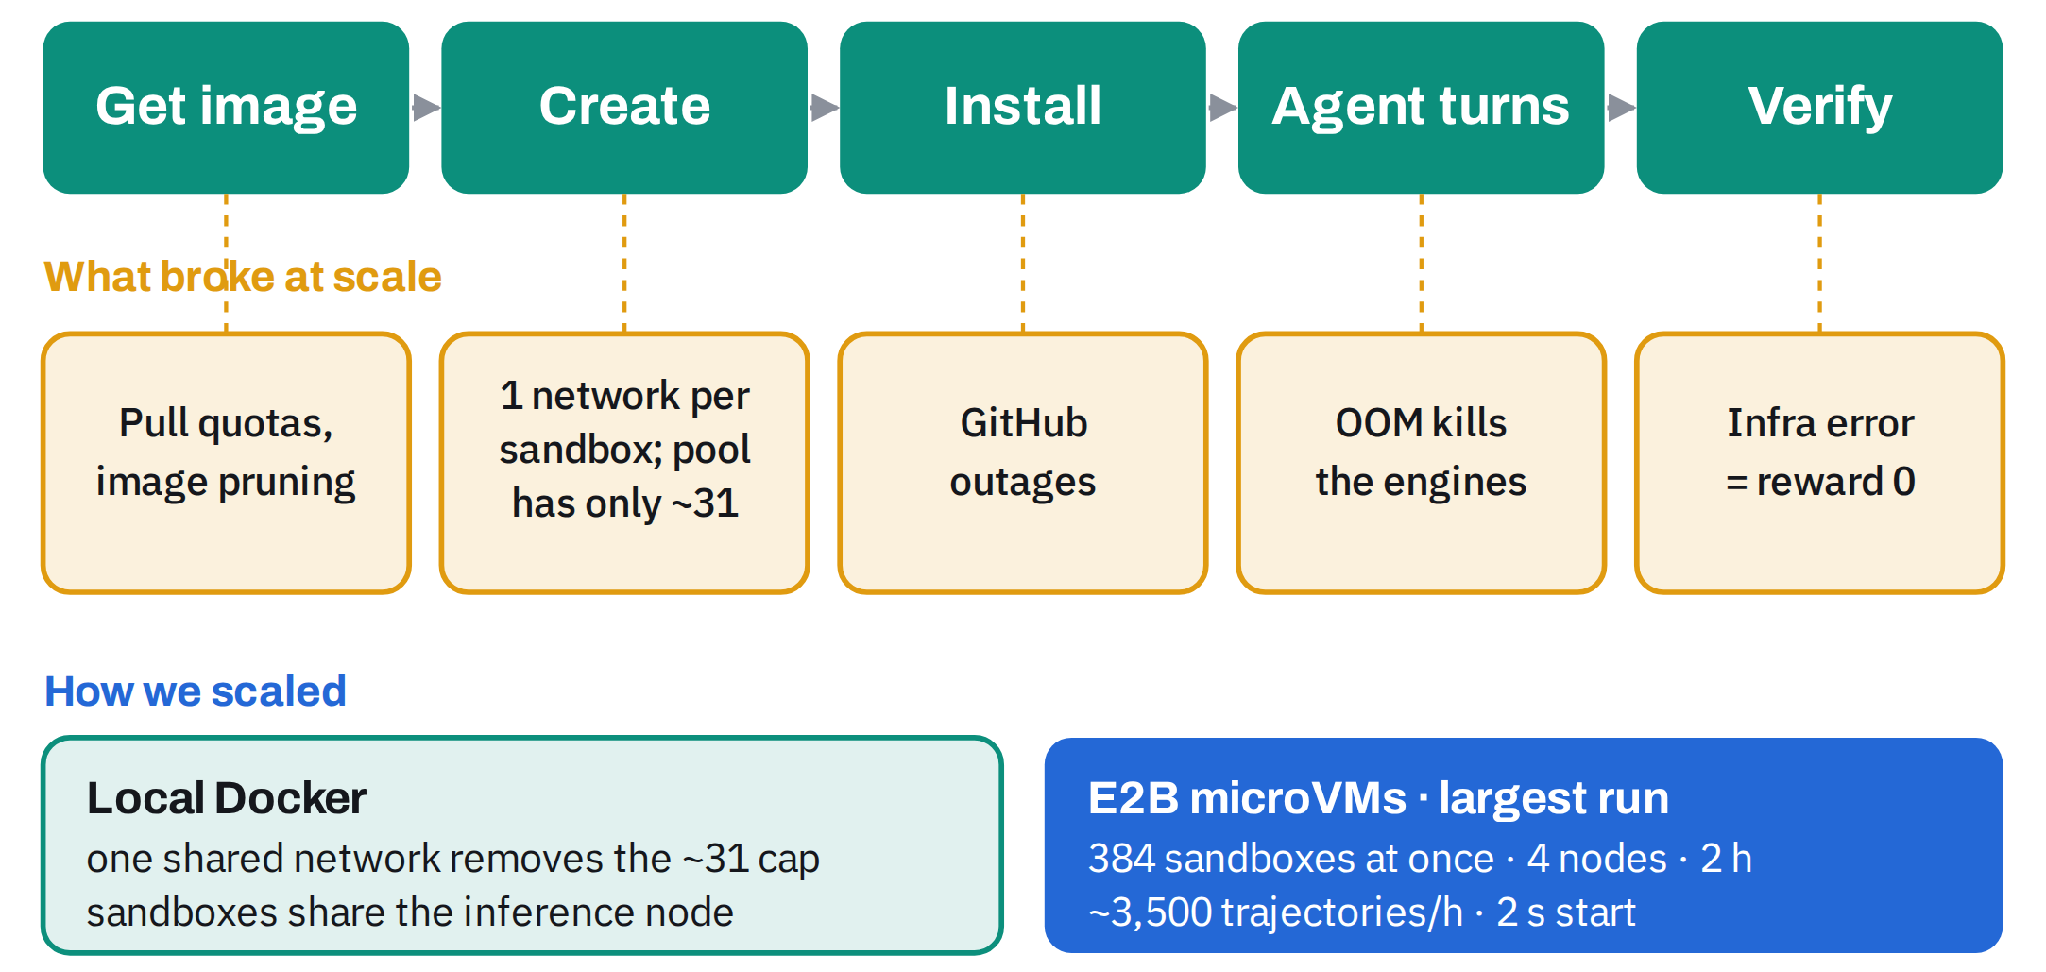
The CPU sandbox is another critical path. Each trajectory needs an isolated environment to install dependencies and run tests. With hundreds in flight, the sandboxes become a CPU fleet. The team moved sandboxes to E2B cloud microVMs with 2 vCPU and 4 GB, at 384 concurrent sandboxes, with 24 single-GPU SGLang engines across 4 nodes and 16 trajectories per engine. Rollout throughput reached about 3,480 trajectories/hour, roughly 4x the local Docker baseline.
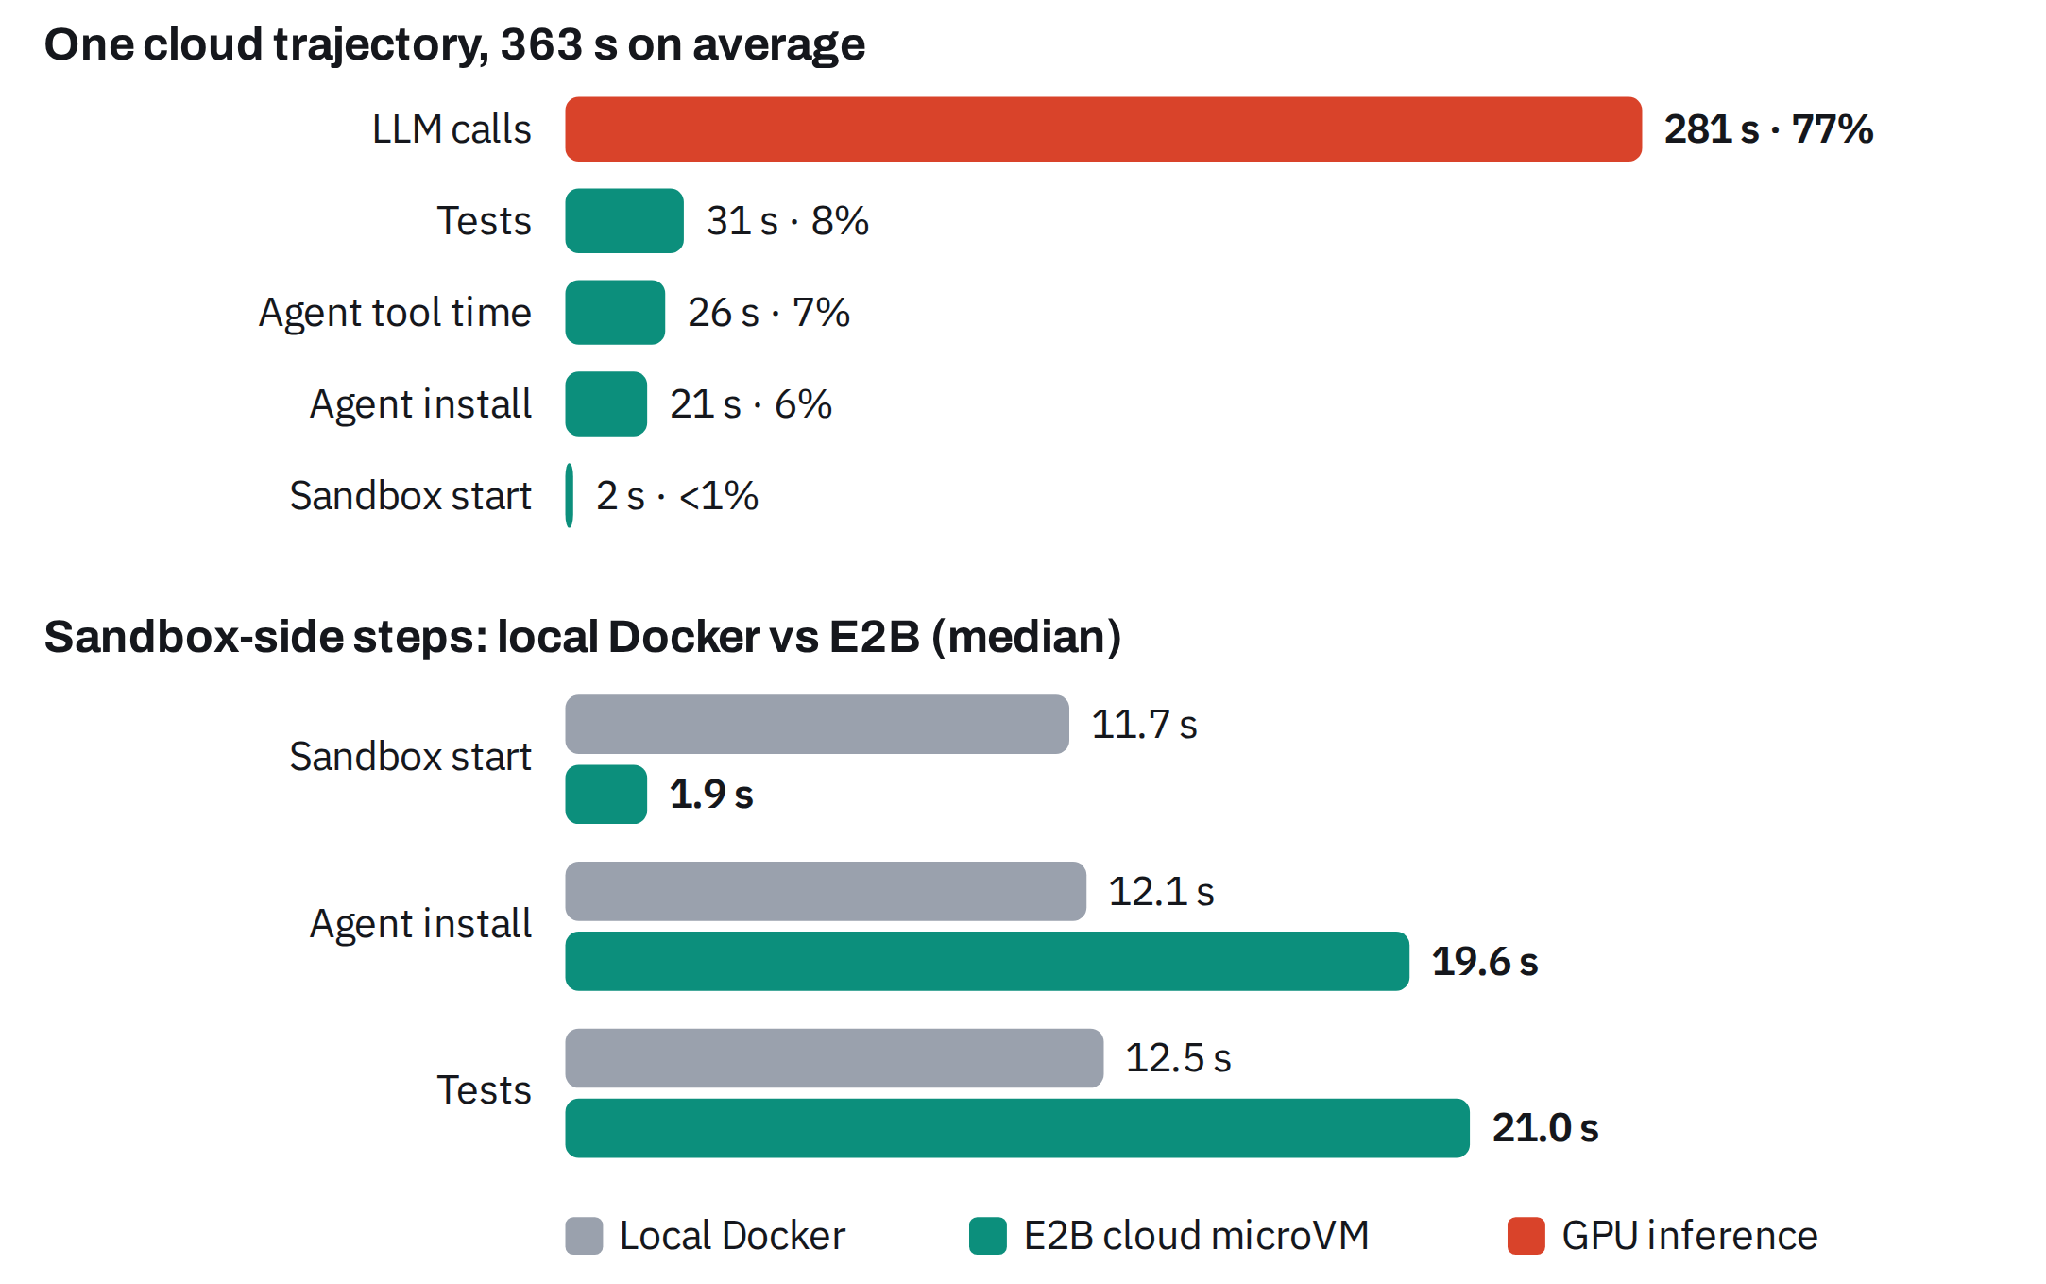
The costs are also clear: cloud sandbox startup has a median of 1.9 seconds and p99 of 3.7 seconds, with no jitter at 384 concurrency; local Docker takes 11.7 seconds under load. Installing the agent is 7.5 seconds slower, running tests is 8.5 seconds slower, and each LLM call over the tunnel costs about 0.26 seconds. That adds 15 to 40 seconds per trajectory, or 4% to 11%. In cloud trajectories, LLM calls account for 77%, while tests, tools, installation, and startup together account for 22%.
At 384 concurrency, the engine queues are empty and KV cache usage peaks at 23%. The bottleneck is sandbox concurrency, not the GPU. In steady state, 2.6% of trajectories fail, and 0.09% of 300,500 tunneled LLM calls report errors.
The most worth-copying takeaway from the report: infrastructure errors become incorrect rewards. 3.1% of trajectories end with an infrastructure error and are scored 0, the same as writing wrong code. The policy takes the blame for infrastructure. These failures must be logged and filtered.
They also listed hidden limits: at most 31 Docker networks per machine, 100 image downloads per hour for the entire cluster, 100 agent connections in Miles, and a single CPU core handling all agent requests. When scaling concurrency, you hit these fixed caps first. Adding bandwidth does not help; removing the caps does.
Key fixes table:
| Fix | Problem | Effect |
|---|---|---|
| Limit trajectory length | Failing agents can loop for 200+ turns, stalling the step | 3x faster step |
| Remove hidden concurrency limits | HTTP pool caps agents at 100; one proxy process serializes all LLM calls | Together with inference scaling and cloud sandboxes, contributes to the ~4x rollout gain |
| Share sandbox network | Docker allows only about 31 sandbox networks per node | Hundreds of sandboxes can run per node |
| Limit context on the engine side | Runaway generation fills the KV cache | No more KV thrashing |
| Pin the NCCL NIC | Cross-node weight sync hangs after selecting duplicate Docker IPs | Reliable synchronization |
| Keep HIP graphs and add a watchdog | Rare GPU faults; disabling graphs halves throughput | Full speed with automatic recovery |
Throughput results: training step time from 850 seconds to 284 seconds, rollout from about 860 to about 3,480 trajectories/hour, concurrent trajectories from about 100 to 384, and LLM call latency under load from 12.6 seconds to 4.4 seconds. The report notes that these numbers come from 2 to 4 MI355X nodes, with the model and RL recipe fixed. The roughly 4x rollout throughput combines scaling inference from one 8-GPU node to three, cloud sandboxes, and removing concurrency limits. The roughly 3x step speedup comes from limiting trajectory length on the same 8-GPU inference node. The two comparisons are kept separate.
Stability: this RL run went for 145 steps and restarted from checkpoints 3 times, with no drift or blow-up in the curves. The 10-step average reward on training tasks rose from 0.13 to 0.17. A single batch swings between 0 and 0.47 because each batch samples new tasks. The median gradient norm was 0.07; at step 140 it reached 0.77, still below the clipping threshold of 1.0, and returned to 0.09 on the next step. The per-token log-prob difference between the trainer and the inference engine averaged about 0.011, and the effective sample size of importance weights averaged 93%. Response length stayed stable at about 30K tokens per trajectory, neither collapsing toward short answers nor blowing past the context limit.
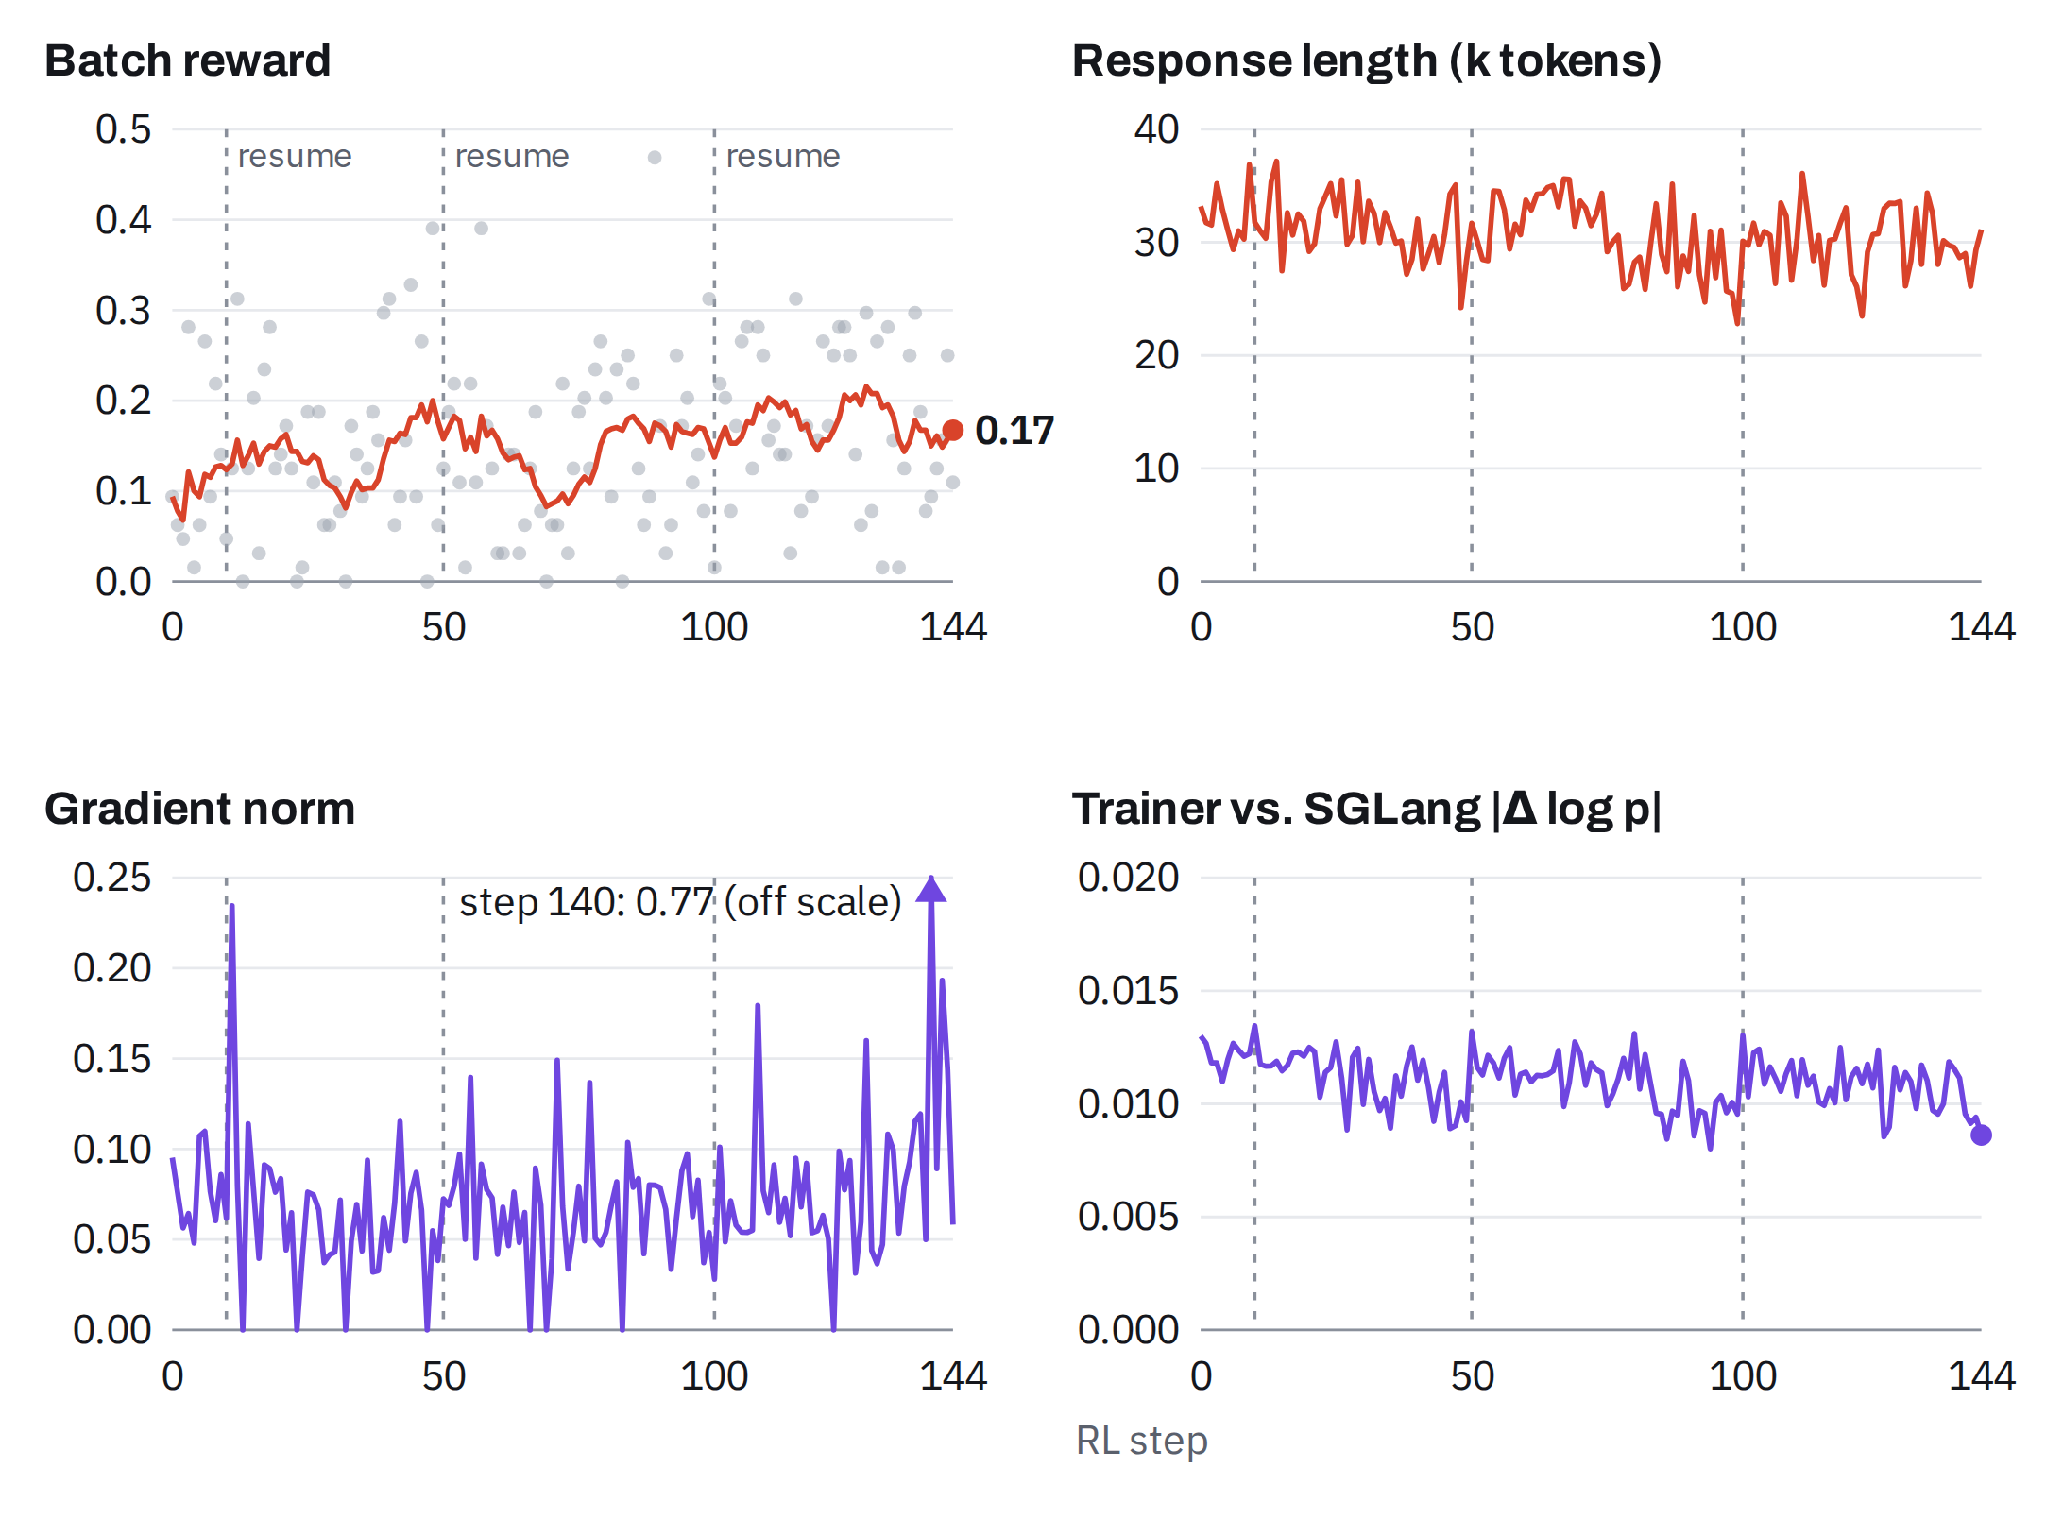
The conclusion returns to engineering judgment: almost every problem in the report initially looked like a GPU problem, and almost none of them were. Long tails, CPU sandboxes, hidden caps, and KV cache limits are what actually hold agent RL back. Next, the team wants to apply the same recipe to models such as DeepSeek-V4-Flash and GLM-5.3, scale beyond 384 concurrent sandboxes, and teach the agent to submit instead of looping all the way to the turn cap.
Source: LMSYS Org tweet, AMD & Miles Team report, link: http://lmsys.org/blog/2026-10-22-miles-mi355x-agentic-rl
发布时间: 2026-10-29 05:28