Qdrant batch import search takes 780ms; changing one experimental parameter drops it to 10.2ms, while new data is temporarily unsearchable
Qdrant tested 13 optimizer configurations with 1.76M vectors: continuous indexing is 180x faster in steady state, prevent_unoptimized brings draining-stage p50 down to 10.2ms, but newly written points become visible with delay. The trade-offs of several configurations are more worth examining than the parameter names.
Qdrant shared a number on X: after bulk importing 1.76M vectors, before the optimizer finishes, search p50 is 780ms; after it finishes, it is 4.3ms. In between there is a recovery window. The article tested 13 optimizer configurations on the same single node, a machine with 32GB RAM and 14 cores; the vectors are Cohere embeddings of MS MARCO passage, 1024-dimensional. The client and instance are on the same machine, so absolute latency is only suitable for looking at relative changes.

The test has three phases: Upload writes only and does not search; Draining searches while waiting for the optimizer to clear the backlog; Steady waits for the optimizer to be idle, then runs a fixed 5,000 queries as a baseline. The article's optimizer includes indexing, merge, and vacuum. In plain terms, a bulk import returning does not mean the index is already suitable for querying.
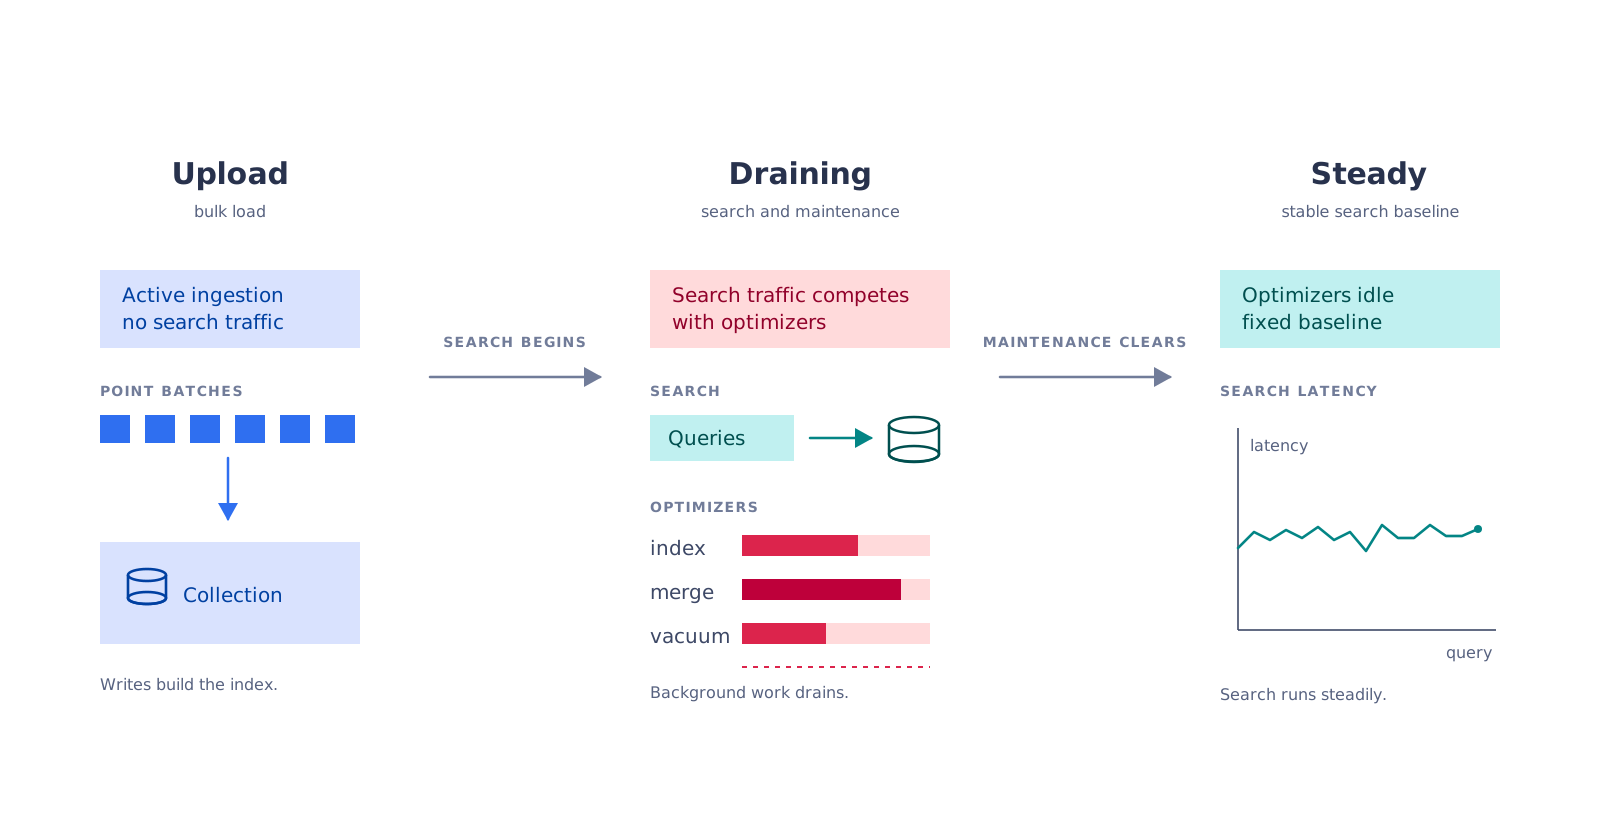
The accounting for continuous indexing: with continuous indexing on by default, draining-stage p50 is 780ms and p95 is 2.0s, with a few queries approaching 10s. Clearing the backlog took more than 11 minutes. After steady state, p50 is 4.3ms and p95 is 7.6ms; median latency drops 180x and p95 drops 263x. Turning off indexing can skip draining: p50 275.5ms, p95 535.1ms. But steady-state search degrades to brute-force scanning, with p50 256.6ms and p95 1400ms; p50 is about 60x that of continuous-indexing steady state. This comparison shows that the recovery window does not come for free.
prevent_unoptimized is the most worth-looking-at experimental parameter in the article; available since Qdrant 1.17.1 and still experimental. It marks points that are newly written but whose segment has not finished optimizing as deferred: the data is already persisted, but temporarily does not participate in search. Already indexed data is unaffected. In the test, draining p50 dropped from 780ms to 10.2ms, 76x; p95 dropped from 2.0s to 81.3ms; optimization completion time shrank from about 11 minutes to 9 minutes. The cost is direct: newly written points will be unsearchable for a period, queries may return fewer results, and even the most recent writes may be missing. Write requests must use wait=false; wait=true will wait for the deferred state to clear, may time out, and can block subsequent writes. For small collections where a brief visibility delay is acceptable, this switch has value; for large collections, measure optimization time first.
Segment size is a harder trade-off. A single segment is fastest in steady state, with p50 3.2ms and p95 4.6ms, but clearing the backlog takes 3602.1 seconds, over 1 hour. The default is one segment per CPU core; clearing the backlog takes 1026.9 seconds, with steady-state p50 4.1ms and p95 5.0ms. Capping segment size at 100,000KB makes backlog clearing take 283.9 seconds, 12.7x faster than a single segment, but steady-state p50 is 17.3ms and p95 is 21.2ms. More, smaller segments make recovery faster and steady-state queries slower. The default is not arbitrary; unless you have a clear latency target, do not casually go to extremes.
Serial optimizer threads are another trade-off. Setting both max_optimization_threads and max_indexing_threads to 1 stretches draining to 3244.1 seconds, versus the default 474.4 seconds, 6.8x slower. In exchange, draining-stage p95 drops from 820.4ms to 373.7ms; p50 rises from 44.0ms to 138.4ms. This suits scenarios that care more about smoothing query tail latency and can wait longer to clear the backlog. Do not assume serial optimization is free.
Vacuum also affects search. Qdrant uses soft deletes: deleted points are first marked, and queries skip them; only when the deletion ratio exceeds deleted_threshold is physical cleanup performed. The test deleted about 25% of the data: a threshold of 0.2 triggers vacuum, and p95 rises from 5.0ms to 22.7ms; a threshold of 0.5 does not trigger it, and p95 drops from 5.4ms to 4.3ms. When you can afford extra disk, raise the threshold to avoid vacuum during search peaks, at the cost of soft-deleted points occupying space.
There is another easy pitfall: turn indexing off first, then turn it on after import. The article tested this operation. Without prevent_unoptimized, after indexing is turned on the optimizer must process the entire backlog at once; search median latency overall reaches 2.7 seconds, with a tail of 12.1 seconds. With prevent_unoptimized on, new points are deferred first, p95 is 621.7ms, steady-state p95 is 5.7ms, and the median returns to around 4.6ms. The conclusion is: do not treat deferred indexing as a way to avoid read/write contention unless you also accept the visibility cost of deferred points.
At the end, the article gives several actionable checks: evaluate prevent_unoptimized before bulk import, and first confirm the Qdrant version; after enabling it, look at deferred_points in collection info; under load a nonzero value is normal, and the key is whether it is decreasing; for large imports you can cap segment size if slower steady-state queries are acceptable; do not assume serial optimization is free; check deleted_threshold against actual deletion patterns; leave a recovery window after bulk load, and do not count only import time; do not assume that turning indexing on later is gentler than having it on from the start.
These numbers come from a single node, a same-machine client, and other work also running on the machine, so absolute latency cannot be used as an SLA. The article also notes that draining-stage samples become fewer because queries slow down, and some latency spikes coincide with OS reclaiming memory and Qdrant's vector cache shrinking. It is more reliable to look at trends and relative multiples. The parameter names look like performance switches, but what is actually being traded is visibility and the recovery window.
Original article: https://qdrant.tech/articles/tuning-qdrant-optimizer/
Tweet: https://x.com/qdrant_engine/status/2115805864473100463
Benchmark script: https://github.com/qdrant-labs/optimizers-in-action
发布时间: 2026-10-29 22:26