All 28 flowchart types are clickable; Tinycharts gives only 9 for free
April Zhu has released Tinycharts Skill, which uses isometric hand-drawn animation to draw processes, timelines, branches, and upgrade paths. Behind each chart is a state machine. The free version has 9 types; Pro has 28 and costs $34.90.
April Zhu has released Tinycharts Skill. It turns processes, timelines, branches, and upgrade paths into small isometric hand-drawn animations, and every chart is clickable. The page puts it plainly: 28 ways to visualize how things work, and the free skill draws only 9 of them.
First, here’s what it looks like. The official examples include a cat’s day, a letter, and ramen time:
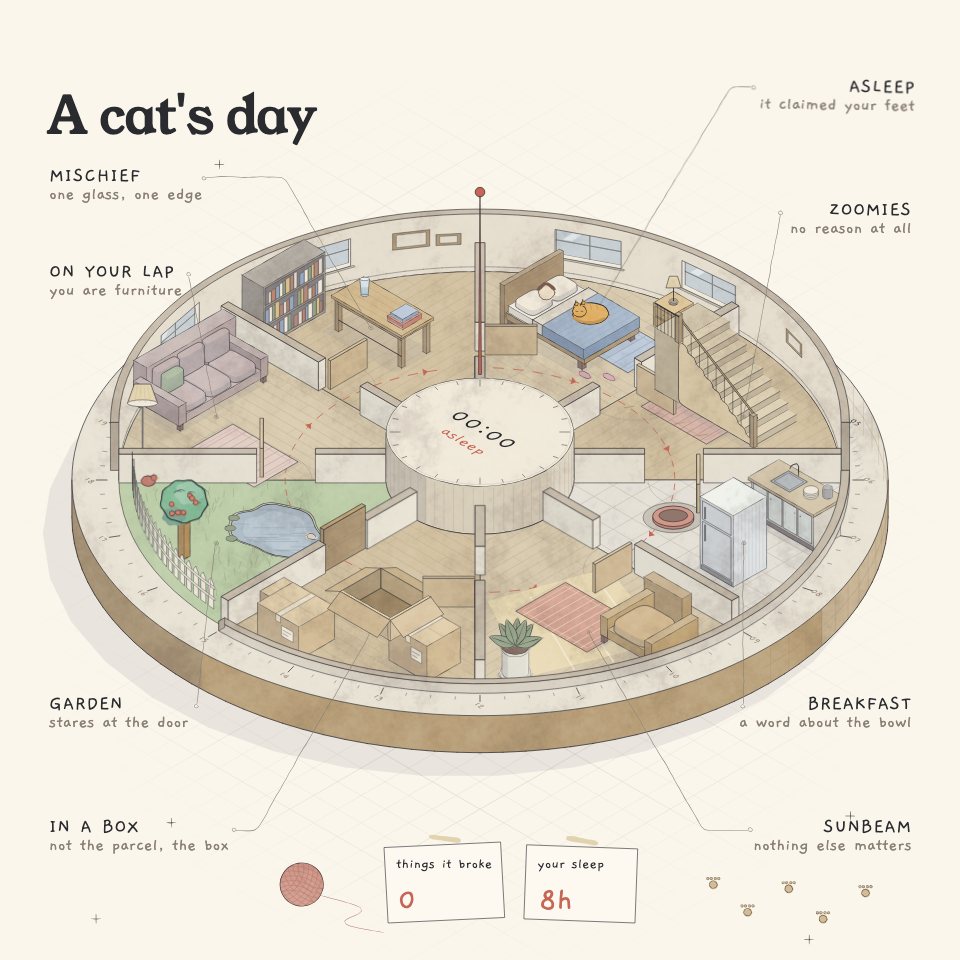
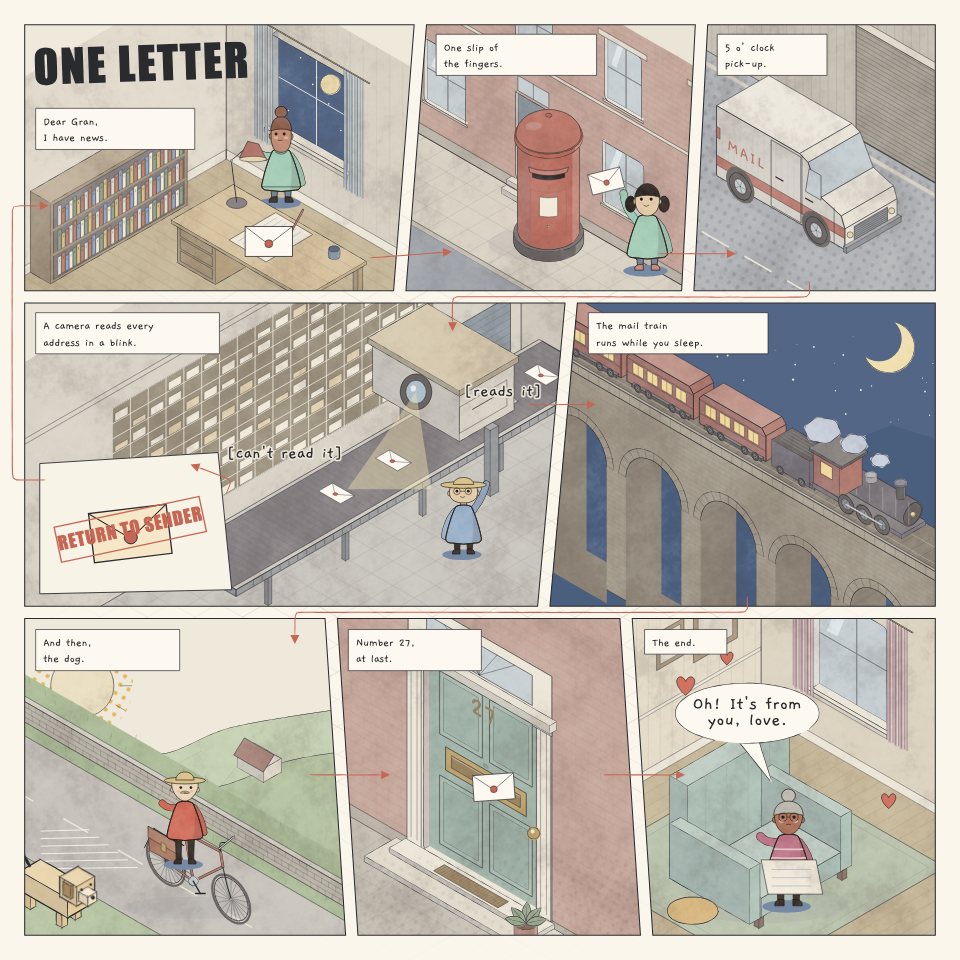
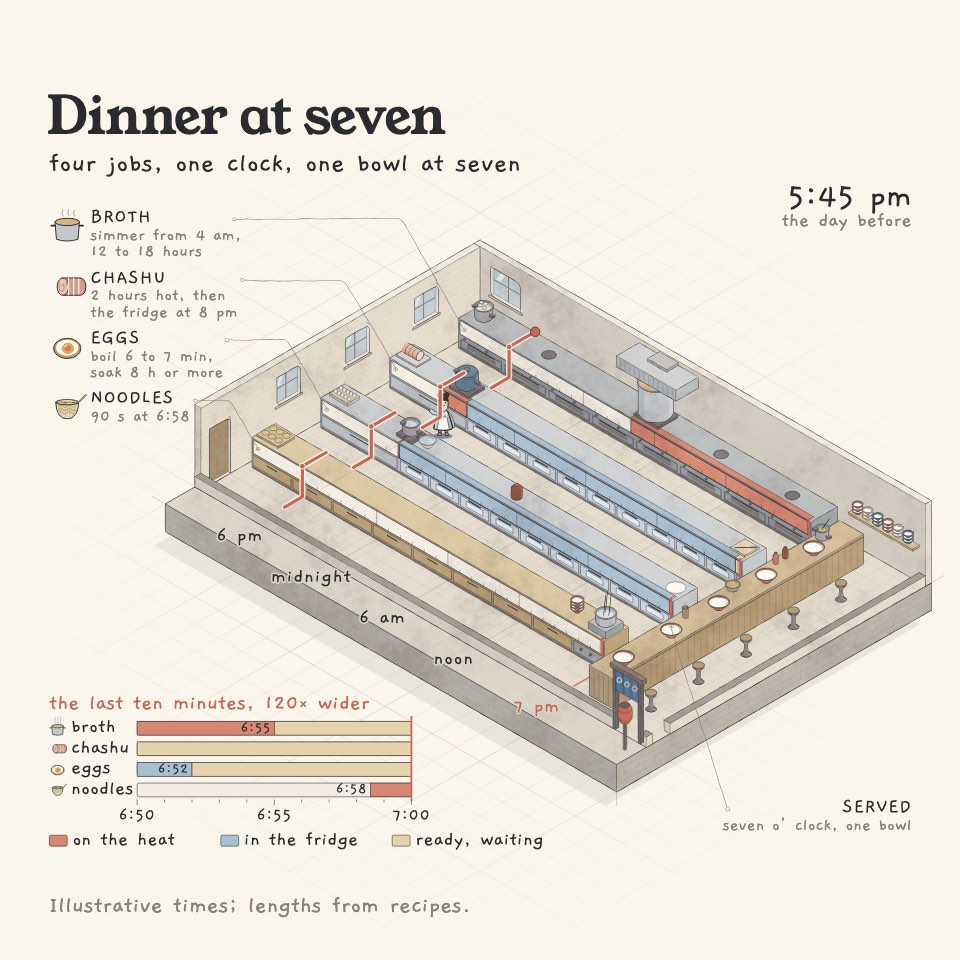
Below is the launch video, where you can see directly how the charts move and how the buttons are clicked:
The key to Tinycharts is behind the buttons. The page explains that every chart is backed by a real statechart, and button behavior follows the rules of the object being shown. The chart is not just a static illustration; the output is self-contained HTML, and opening the logic panel reveals the rules and flowchart.
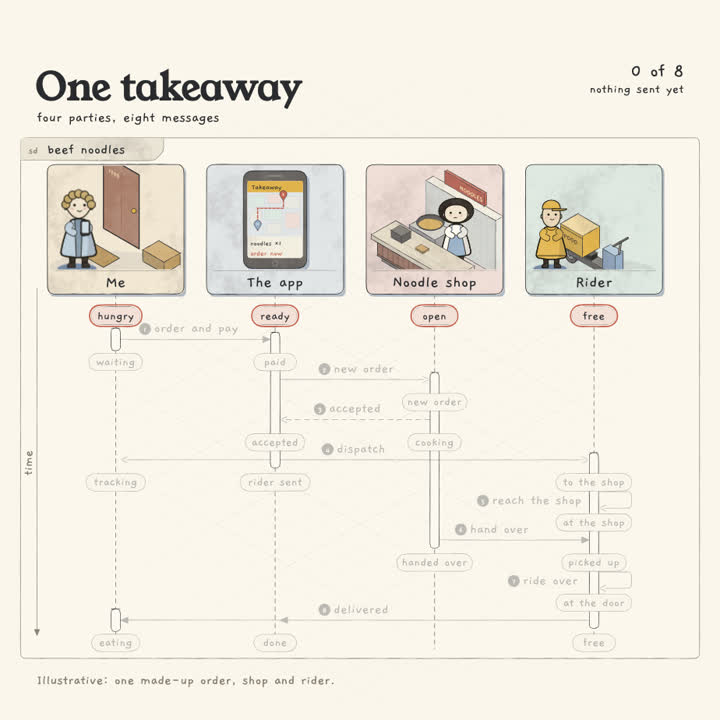
The scenario it aims to solve is very specific: explaining a process. How does a refund proceed, whose hands does a takeout order pass through, how does a week of weather affect whether laundry dries, and at which step does a request get stuck? The page gives three examples of automatic chart selection: when you enter Order a takeaway, it chooses a sequence diagram; when you enter Draw our refund process, it chooses a flowchart; when you enter A week of weather, it chooses bands. Pro also explains why it chose that chart.
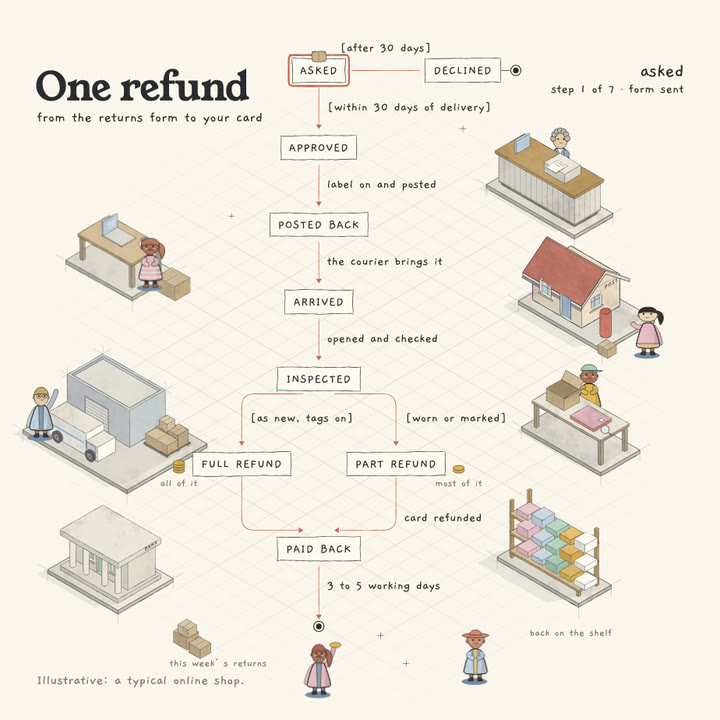
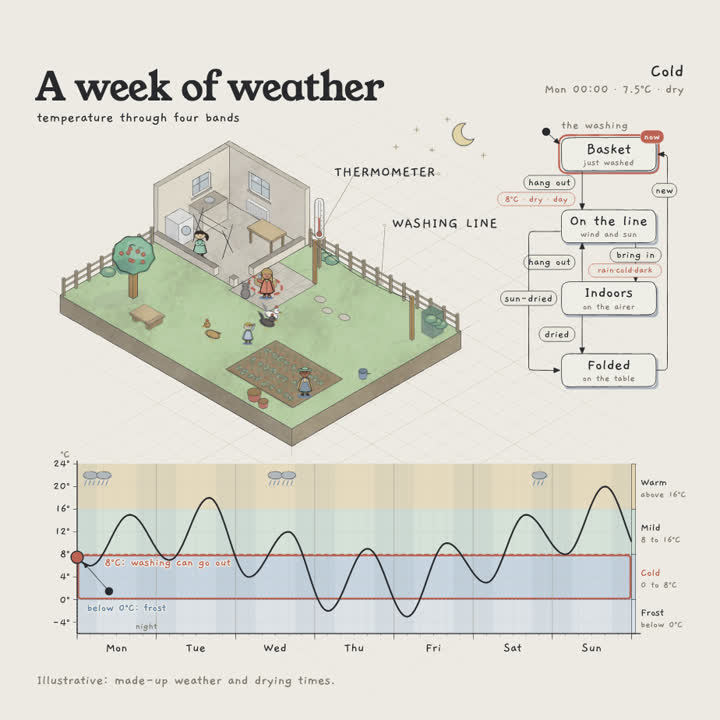
The boundary between Free and Pro is clear. The free skill gives 9 chart types for personal, non-commercial use; Pro gives all 28, with editable templates, Chinese charts, and a commercial license, for $34.90. All Access is a one-time $99 purchase, limited to the first 100 early buyers, and includes the packs currently in the store plus future updates. The page also states that digital downloads are non-refundable and recommends trying the free skill first.
There are two ways to install it. Run one line in the terminal:
mkdir -p ~/.claude/skills && curl -fsSL https://april-zhu.com/tinycharts/tinycharts.tar.gz | tar -xz -C ~/.claude/skills
On Claude.ai, download the .skill file and upload it under Settings → Capabilities → Skills. Using it requires Claude Code, or Claude.ai with skills enabled. Charts open in the browser, and you don’t need to write any code yourself.
Several comments are worth reading. Someone asked whether the charts could be bigger, and the author replied, "is it too smol for you." Another person said the logic panel is the best part and hoped for a replay button for counterexamples, so a bad path could be replayed on the chart. That suggestion gets closer to the tool’s value than simply adding more chart types: when explaining a process, being able to see how an error path happens is more useful than looking at a correct flowchart. Someone else asked for the charts to be put on GitHub and criticized charging for @poteto’s work. The page notes that the inspiration comes from Kevin T. Ngo’s statechart-art and that the logic checks come from Lauren Tan’s (@poteto) statechart skill under the MIT license. The materials don’t provide more details about packaging and licensing, so that criticism can only be treated as feedback for now.
Tinycharts’ selling point is not the number 28. Even with more chart types, users still face the problem of choosing a chart. Its more practical value is that it lets the model first decide which chart to use, then packs state-machine logic into a clickable page. Whether 9 free types are enough depends on the complexity of the process you want to explain. Try the free skill first, then decide whether to pay $34.90 for templates, Chinese charts, and a commercial license; that path is more reliable.
Project page: https://april-zhu.com/tinycharts
发布时间: 2026-11-05 17:36