AI curve looks steep enough to be a glitch, but most of the 'diamonds' on the chart are estimates
Paul Graham reposted a METR time-horizon chart and said that if it is real, the growth is absurdly fast. Ben Todd extrapolated using an internal index, and the comments are arguing over measurement definitions. A linked long-form essay pushes the trend to superhuman AGI in 18 months; the question is whether these trends can get past pitfalls such as task framing, verification, and judgment.
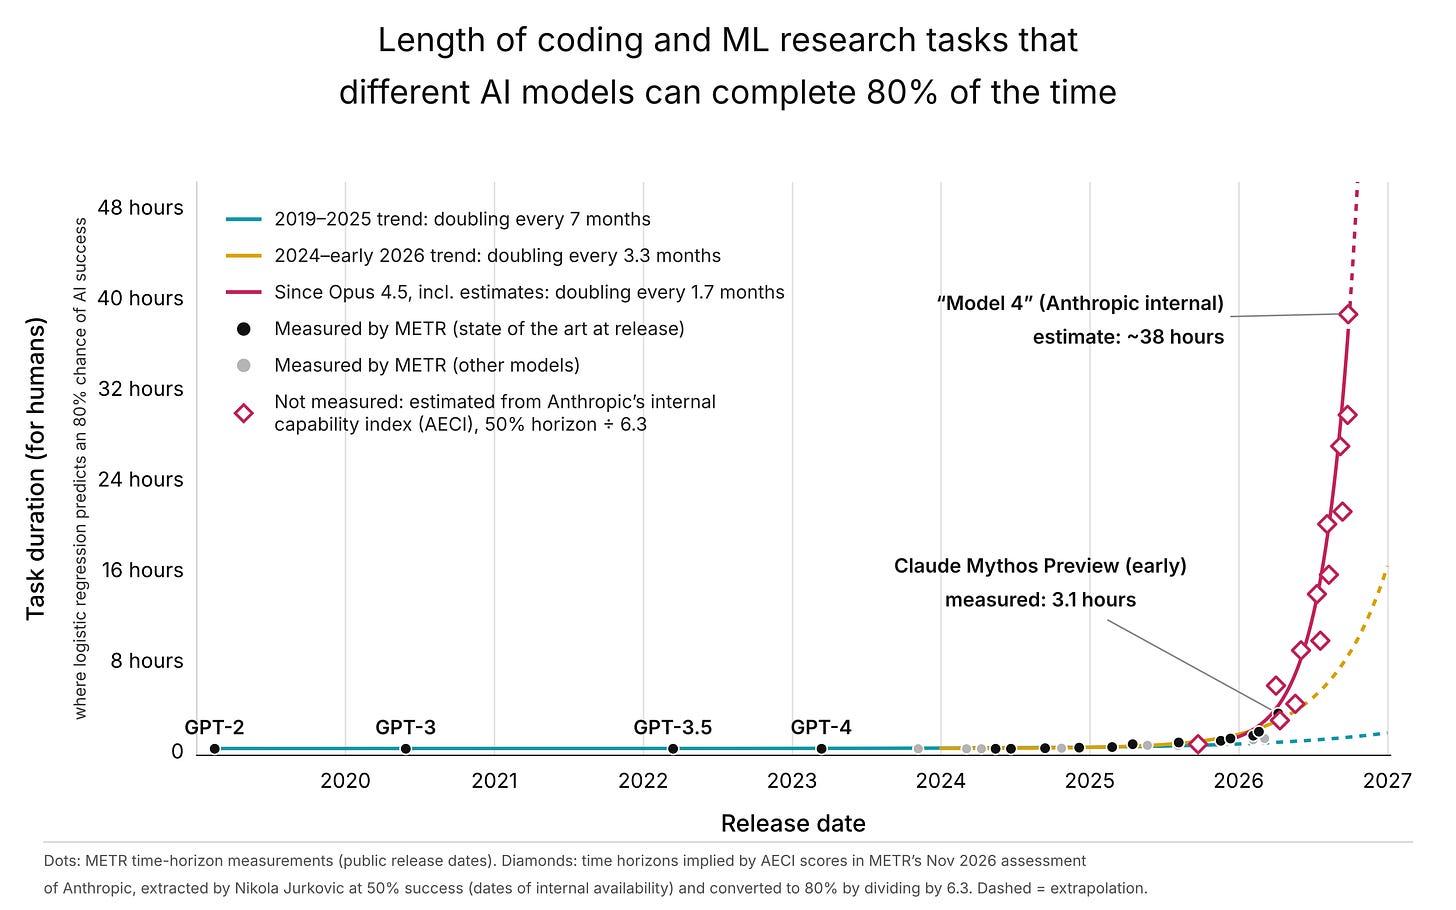
On November 16, Paul Graham reposted Benjamin Todd's updated METR chart with the caption "If this is real, this is stupendously fast growth." On a log axis, the curve is almost vertical.

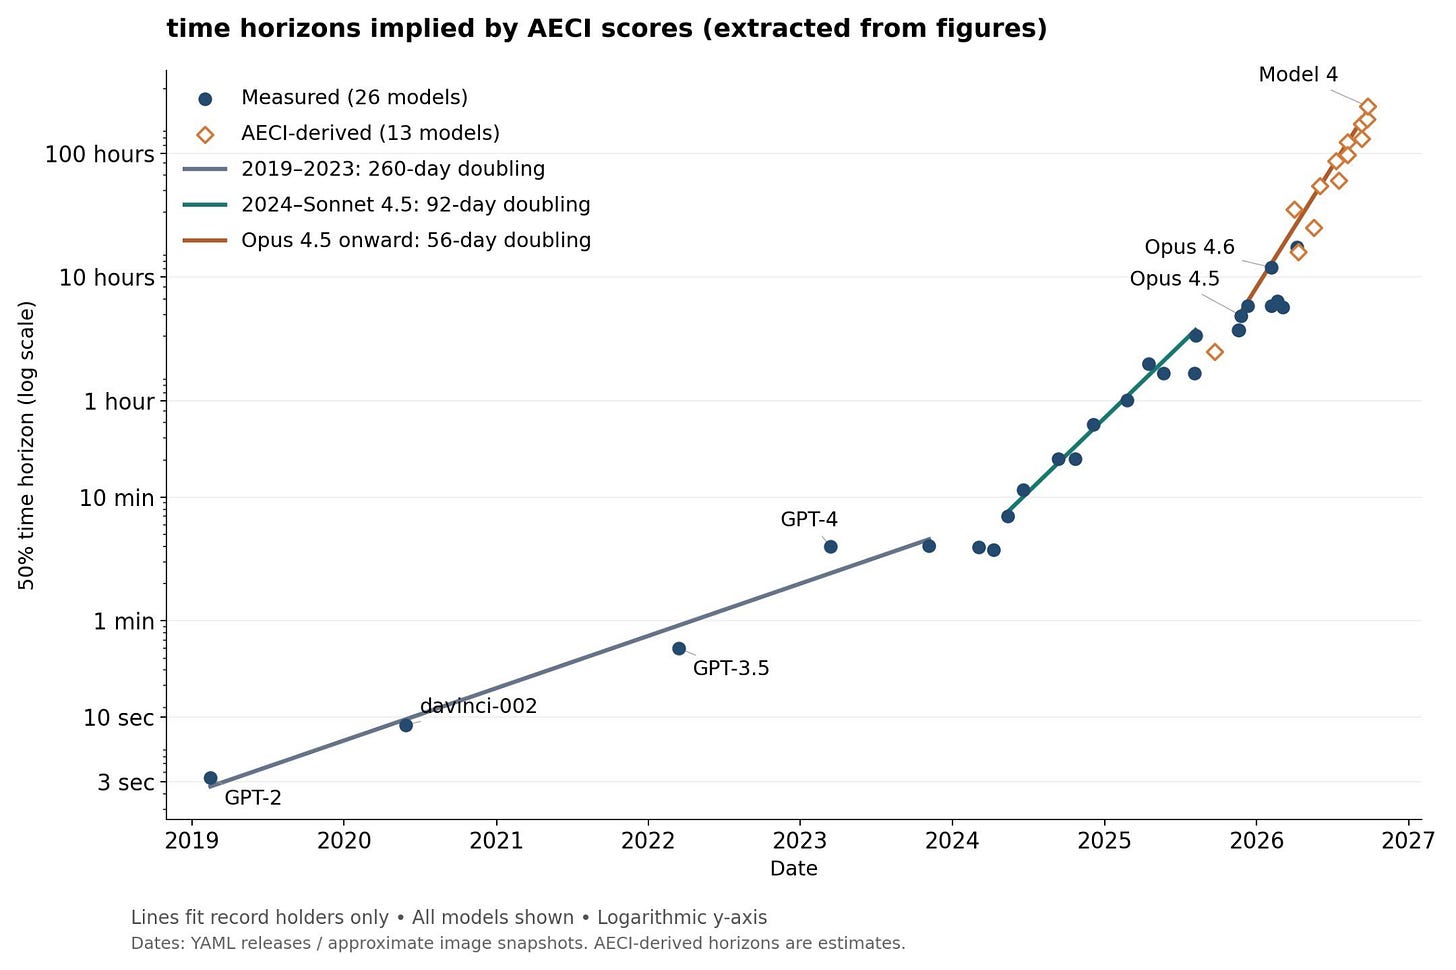
METR's time-horizon benchmark is not complicated. Give an AI a set of engineering, cybersecurity, and computer-operation tasks; first measure how long it takes human experts to do those tasks, then look at the longest task the model can complete at a given level of reliability. Traditionally METR tested public models, but the official chart is no longer updated, on the grounds that the time horizons are too long to measure. Ben's chart picks up after the official data and uses extrapolation from Anthropic's internal AECI score. He himself explains clearly in a reply: divide the 50% time horizon by 6 to get the 80% time horizon; it's very rough, but based on Fable 5.2's performance, a roughly 30-hour task looks about right.
The first comment in the thread immediately pushes back. Amy says the diamonds are not measured—only the black dots are real data, and the rest are someone's estimates. Ihtesham Ali breaks down the steep section further: the only thing METR actually measured is Claude Mythos Preview at 3.1 hours; Model 4's 38 hours is estimated by dividing Anthropic's internal index by 6.3. cherub says AECI and ECI diverge a lot, and using ECI to calculate Opus 5.5 or Fable 5.2 would give a completely different time horizon. Adam Karvonen adds another point: this chart only applies to well-defined, verifiable benchmark tasks; messy AI R&D tasks are much slower, and in OpenAI's report the time horizon at 80% reliability is under 30 minutes.

Ben's linked long-form essay pushes things further. His two core metrics are revenue and task time horizon. On revenue, OpenAI and Anthropic surpassed $115 billion annualized in September 2026, growing 3x in 2024, 4.7x in 2025, and 6x in 2026. On time horizon, from 2019 to 2023 it was about 3x per year, from 2024 to 2025 it was 8x per year, and in 2026 it doubled again to about 50x per year. He thinks these trends are accelerating and are not the usual S-curve.
More important is recursive self-improvement. In an internal Anthropic survey, researchers said AI had raised their productivity from 2x to 4x and then to 12x. After an independent assessment, METR largely agrees: since October 2025, Anthropic's progress has accelerated by about 1.9x, of which about 80% comes from using AI to accelerate its own research. In August, Claude was already leading 26% of model R&D work; in January it was still 0%. Ben uses a simple model to reason it out: each time progress doubles, the time required halves—12 months, 6 months, 3 months, 1.5 months. His judgment is that there is a greater than 30% probability recursive self-improvement has already begun, with broad superhuman AGI in 6 to 18 months; a 25% probability it slips to the 2030s; and a 20% probability it takes decades.
The counterarguments are not weak either. In the comments, Steffen Rentschler says the revenue inference is directionally flawed: you estimate how much companies would be willing to pay for AI that can do most office work, and then treat that spending level as evidence that AI can do most office work. Task time horizon has the same pitfall: a system solves a problem that would take an expert three weeks, but who chose the problem, who set the assumptions, and who defined what counts as a solution? Three weeks of work within a given frame does not show whether the system can discover that the frame itself is wrong. In recursive self-improvement, researchers are still identifying weaknesses, choosing experiments, and judging whether results count as progress. Measuring how much faster the team is does not tell you when the model can take over those judgments. He also lists semantic problems, framing problems, and safety problems.
Boogaloo brings the topic back to the physical world. He thinks that even with ASI, building an industrial nation on China's scale would take at least 14 years, with more probability mass beyond 25 years. How supply chains operate, where they are, and whether they can be scaled on a timetable are not automatically solved by dropping in unlimited labor.
The chart is scary, but the scary part needs to be taken apart. Black dots are measurements; diamonds are extrapolations. AECI is a composite score from Anthropic's internal benchmarks, and mapping it to METR time horizons goes through historical correlation. Correlation can serve as a bridge, but the bridge's load-bearing capacity is unlabeled. On the other hand, if you look only at well-defined, verifiable tasks, the acceleration is real. The trouble is that most real work is not verifiable, the context is messy, and the success criteria change. The trend may continue, but getting past these pitfalls requires a different kind of evidence, not just drawing the same line longer.
In the comments, someone asks what the first job to be eaten will be, and someone else asks about six-month retention. Both are asking the right questions, and the chart cannot answer them. When you see a curve like this, ask three things first: where did the points come from, how big is the error, and who defined the task? A chart can serve as an alarm, not a verdict.
Reference links: Paul Graham tweet, Benjamin Todd tweet, linked long-form essay
发布时间: 2026-11-17 08:30